Today, we’re diving into a topic that has haunted digital marketers for years: channel groupings. If you’re feeling a mix of dread and confusion, you’re not alone.
Think of channel groupings like the messy closet in your marketing analytics house. You keep shoving things in, hoping to sort it out “later,” and before you know it, the clutter is out of control. Nearly every brand we work with has a cluttered analytics closet—and it’s not because they don’t have smart people on their team. It’s because there are so many ways things can go wrong.
Today, we’re going to tackle this head-on. We’ll break down where channel groupings go wrong, why it matters, and most importantly, how you can organize this chaos to unlock better insights. Trust me—getting this right is like finally finding that missing sock you’ve been searching for.
Where Things Go Wrong: The Origins of Poor Channel Groupings
A diverse group of marketing professionals, including a Caucasian woman and a Hispanic man, are gathered around a table cluttered with laptops and digital marketing materials. They display expressions of concern as they analyze data on a laptop screen. The room is filled with symbolic elements of digital marketing, such as abstract graphs and creative social media icons, creating an atmosphere that highlights their intense focus on the evolving landscape of marketing practices.
So, why are channel groupings such a mess? A big part of the problem started years ago, back when digital marketing was still getting its footing. CFOs were allocating budgets and needed a simple answer to the question: “What did we get for the money we spent?” Back then, marketers lumped all their paid media into a single bucket to give a quick number back to leadership. That worked at first, but it set up some bad habits.
As platforms evolved, with new ways to target and segment audiences, many marketers didn’t evolve their groupings along with them. They kept rolling things up into one number without realizing that they were missing out on the insights that could actually improve their marketing performance.
Another big issue? The platforms themselves weren’t set up for this level of detail when digital marketing first started exploding. Even as more sophisticated tracking tools emerged, they weren’t necessarily optimized to help you see how granular you could get with your data.
Understanding Slices and Segments
A Caucasian woman and a Hispanic man, both dressed in professional attire, are engaged in a discussion in a modern office setting. They are positioned near a large screen filled with colorful data charts and graphs. The scene conveys teamwork and clarity, highlighting their focus on analyzing the visual data. The environment is sleek and contemporary, emphasizing collaboration without any visible text or artistic embellishments.
All right, let’s cut through some of the jargon. If you’ve ever worked with data engineers or analytics teams, you’ve probably heard them talk about “slices,” “segments,” and “dimensions,” and you might have gotten a blank stare trying to make sense of it all. So, let’s make it simple.
Metrics are things you can count. Think users, sessions, purchases, or leads. Those are all metrics—concrete numbers that track your outcomes.
Dimensions (or slices, if you want a more digestible term) are the categories you use to break those numbers apart. For example, you can slice users by where they came from (like a paid search campaign), by what device they used (mobile vs. desktop), or by whether they’re a new or returning customer.
Having good slices is crucial. Without them, you’re basically just staring at a pile of numbers with no way to figure out what’s working and what’s not. Slicing your data correctly lets you uncover actionable insights—the kind that help you optimize your campaigns and drive better performance.
Why Default Channel Groupings Fail
A cluttered office space resembling a jam-packed closet, filled with various marketing analytics tools, digital devices, and an array of colorful charts and diagrams. The environment appears chaotic yet inviting, with items haphazardly stacked and scattered around. Soft natural light filters in from a window, illuminating the scene and creating a sense of discovering clarity amidst the disorder.
Now, let’s talk about default channel groupings, like the ones you get in Google Analytics. At first glance, they seem helpful—Google Analytics gives you groupings like paid search, paid social, organic search, and more. But here’s the problem: they’re grouped based on where you spent money, not why.
For example, you might be running ads on YouTube targeting two very different audiences—people who’ve never heard of your brand (prospecting) and people who’ve already interacted with your site (retargeting). These are two completely different strategies, yet Google’s default grouping throws them into the same “paid video” bucket.
Another classic mistake is lumping branded and non-branded paid search together. If someone’s searching for your brand name, they’re already aware of you—those leads are much easier to convert. But if someone is searching a general term, like “best camping tents,” that’s an upper-funnel search and a different beast altogether. If you treat them the same, you’ll miss key performance differences and opportunities to optimize.
What Good Channel Groupings Look Like
A diverse group of professionals, including a focused Caucasian woman and an engaged Asian man, collaborate over a laptop displaying intricate graphs and charts related to marketing data. They are in a sleek, modern office with contemporary design elements, symbolizing teamwork and deep analysis within the digital marketing field. The scene captures their intense concentration as they discuss strategies, surrounded by digital devices that enhance their collaborative efforts.
So, what does a good channel grouping look like? It starts with grouping campaigns by intent, not just by the platform or vendor where you’re spending money.
Here are a few examples of how to group channels more effectively:
Paid Search:
Branded vs. Non-Branded
Competitor search terms
Paid Video:
Prospecting (new audience)
Retargeting (existing audience)
Display Ads:
Prospecting vs. Retargeting
Email:
Transactional vs. Promotional
Prospecting vs. Customer Nurturing
By segmenting based on intent, you can start to see where your money is working hardest and where you might need to adjust. For example, your ROI on branded paid search will always look better than on non-branded—because branded searches are lower in the funnel. When you separate them, you get a clearer view of what’s really happening.
The Logic Behind Direct Traffic & Attribution Loss
A frustrated male business analyst of Hispanic descent sits in a modern workspace, surrounded by complex charts and graphs. He stares at a sleek computer monitor displaying data analytics graphics, with a specific area highlighted to suggest 'direct traffic' through distinct symbols. The atmosphere conveys the challenges of tracking online traffic sources.
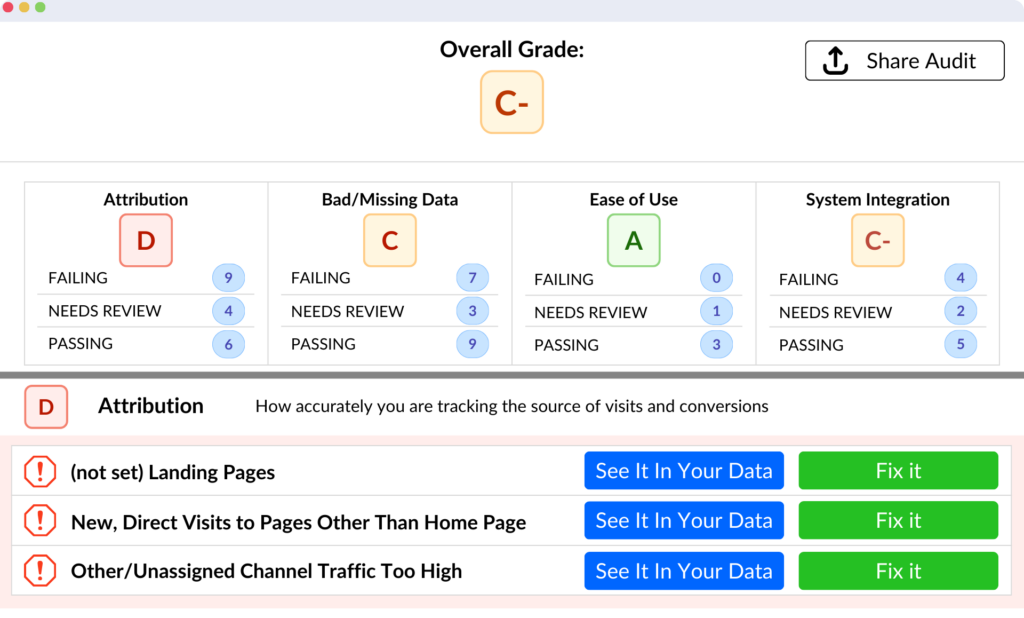
Let’s shift gears for a moment to talk about one of the most common issues we see with channel groupings: direct traffic. Have you ever logged into your analytics and seen a huge chunk of your traffic listed as “direct”? It’s frustrating, right? You know people aren’t typing your URL into the browser bar every time they visit your site. So why does it happen?
The problem often comes down to how Google Analytics tracks visits. Here’s the logic Google uses to figure out where a visitor came from:
First, it looks for a GCLID (Google Click Identifier), which tells Google the click came from an ad.
If there’s no GCLID, it looks for UTM parameters (those little tags you put in your URLs).
If it can’t find UTM parameters, it checks the referrer—essentially, the page that sent the visitor to you.
If all else fails, Google throws its hands up and labels the visit as “direct.”
There are countless scenarios where this process breaks down—email links, app referrals, even redirects from HTTP to HTTPS. Each of these can strip the tracking info out of the link and throw traffic into the dreaded “direct” bucket.
Retroactive Fixes: Adjusting Channel Groupings with Modern Tools
Here’s the good news: modern tools like GA4 and BigQuery allow for retroactive fixes. Back in the day, once you set your channel groupings, you were stuck with them. If you wanted to make changes, you’d have to start tracking everything all over again. But not anymore.
With tools like late data binding, you can change how your data is grouped even after it’s been collected. Let’s say you realized six months into a campaign that you were miscategorizing some of your traffic. With a modern setup, you can adjust those categories and apply the new groupings retroactively—no need to start over.
Pro tip: Always include campaign IDs in your UTM parameters. They’ll save you a headache when campaign names change or get updated. IDs help you keep a clean and consistent connection between cost data and performance data.
Conclusion: Why Clean Channel Groupings Matter
A diverse group of three professionals collaborates around a digital tablet displaying symbolic analytics data. The Caucasian male data analyst points at the screen while the Hispanic female strategy manager and Asian female project coordinator engage with the information. They are in a modern office, surrounded by charts and graphs on the walls that illustrate data organization. The atmosphere is positive and focused, reflecting their shared goal of enhancing marketing insights through effective channel grouping.
At the end of the day, organizing your channel groupings correctly is one of the most powerful steps you can take to improve your marketing insights. When you group your campaigns based on intent, not just vendor or platform, you unlock a whole new level of understanding about how your media dollars are performing.
And let’s be honest—if your “direct” traffic is sitting at 80%, something’s definitely off. Whether it’s missing UTM tags or broken redirects, getting to the bottom of that mess will give you clearer data and better insights.
So if you’re nodding along thinking, “Yes, this is exactly what I need to fix,” we’d love to help. Head over to admindanalytics.com and schedule a discovery call with Mike and me. There’s no cost for an initial consultation, and we’ll help you start organizing that analytics closet once and for all.
Thanks for tuning in, and we’ll see you next time!
Share:
Ready to see how proper analytics can drive growth for you?